Hallo zusammen,
Zuerst möchte ich erwähnen dass ich sehr sehr sehr lange in Google gesucht habe, leider bin ich nicht fündig geworden.
Ich möchte meine Attribute von XML auslesen in einer JFreeChart auslesen, in Form von Dataset.
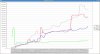
z.B ich möchte ein LineChart ausgeben (siehe Anhang) von den Attributen die in meine XML Datei stehen, soll diesen Chart befüllen.
Ich habe eine passende Query dazu allerdings dies läuft in Backend und funktioniert einwandfrei.
Mein Chart soll zum Beispiel so aussehen wie in den Anhang.
So siehst mein Programm momentan aus.
[XML]<?xml version="1.0" encoding="UTF-8"?>
<OptimISEGuiModel>
<MainButton>
<ChartName>LOC</ChartName>
<charttype basetype="Cartesian">
<chartrenderer useAlertColors="true" type="LineChart" mode="LineChart"> </chartrenderer></charttype>
<legend visible="true" position="right" background="white" foreground="" />
<labelrenderer color="" offset= "" rotation= "" visible=""/>
<datasetlegend match="" display="Arch" showValue="true" showStart=" (total: " showEnd=")"/>
<graph name="Arch" value="50" color="0x808080"/>
<datasetlegend match="" display="Other" showValue="true" showStart= " (total: " showEnd=")" />
<graph name="Other" value="50" color="0xCC3333"/>
<datasetlegend match="" display="Model" showValue="true" showStart=" (total: " showEnd=")"/>
<graph name="Model" value="50" color="0x0000FF"/>
<datasetlegend match="" display="App" showValue="true" showStart=" (total: " showEnd=")" />
<graph name="App" value="50" color="0x009F6B"/>
<!-- not sure if this is going to work -->
<xaxis>
<annotation match="App" text="ReportingDate"/>
</xaxis>
<yaxis> <annotation match="" text=""/></yaxis>
<Archcolor> value="Grey"</Archcolor>
<Othercolor> value="Red"</Othercolor>
<Modelcolor> value= "Blue"</Modelcolor>
<Appcolor> value="Green"</Appcolor>
</MainButton>
<MainButton>
<ChartName>Sir Statistics</ChartName>
</MainButton>
<MainButton>
<ChartName>Test Statistics</ChartName>
</MainButton>
<MainButton>
<ChartName>Issue</ChartName>
</MainButton>
<MainButton>
<ChartName>Rappidd</ChartName>
</MainButton>
</OptimISEGuiModel>
[/XML]
Zuerst möchte ich erwähnen dass ich sehr sehr sehr lange in Google gesucht habe, leider bin ich nicht fündig geworden.
Ich möchte meine Attribute von XML auslesen in einer JFreeChart auslesen, in Form von Dataset.
z.B ich möchte ein LineChart ausgeben (siehe Anhang) von den Attributen die in meine XML Datei stehen, soll diesen Chart befüllen.
Ich habe eine passende Query dazu allerdings dies läuft in Backend und funktioniert einwandfrei.
Mein Chart soll zum Beispiel so aussehen wie in den Anhang.
So siehst mein Programm momentan aus.
Java:
import java.awt.Color;
import java.awt.Component;
import java.awt.Dimension;
import java.awt.FlowLayout;
import java.awt.Font;
import java.awt.event.ActionEvent;
import java.awt.event.ActionListener;
import java.sql.Connection;

import javax.swing.BorderFactory;
import javax.swing.BoxLayout;
import javax.swing.JButton;
import javax.swing.JFrame;
import javax.swing.JPanel;
import javax.swing.border.TitledBorder;
import javax.xml.parsers.DocumentBuilder;
import javax.xml.parsers.DocumentBuilderFactory;

import org.jfree.chart.ChartFactory;
import org.jfree.chart.JFreeChart;
import org.jfree.chart.plot.PlotOrientation;
import org.jfree.data.category.CategoryDataset;
import org.w3c.dom.Document;
import org.w3c.dom.Element;
import org.w3c.dom.NamedNodeMap;
import org.w3c.dom.Node;
import org.w3c.dom.NodeList;

@SuppressWarnings("serial")
public class ComponentPanel extends JFrame implements ActionListener {

	Connection con;

	private static final String
	tablename = "LOC", // just an example
	valuenames = "reportingDate";// just an example
	private CategoryDataset dataset;
	String name;
	public ComponentPanel() throws Exception {
		super("OptimISE Component Model");

		setDefaultCloseOperation(JFrame.EXIT_ON_CLOSE);
		setLayout(new BoxLayout(getContentPane(), BoxLayout.Y_AXIS));
		setSize(new Dimension(250, 270));
		add(createComponentPanel(), getLayout());

		pack();
		setVisible(true);
	}

	private Component createComponentPanel() throws Exception {

		// ---- Panel which holds the Buttons ----
		JPanel p = new JPanel(new FlowLayout(FlowLayout.CENTER, 10, 10));
		p.setBorder(BorderFactory.createTitledBorder(null, "",TitledBorder.DEFAULT_JUSTIFICATION,
				TitledBorder.DEFAULT_POSITION,new Font("Dialog", Font.BOLD, 12), new Color(51, 51, 51)));

	      // ---- Parse XML file ----
		DocumentBuilder db = DocumentBuilderFactory.newInstance().newDocumentBuilder();
		Document doc = db.parse(getClass().getResourceAsStream("OptimISEGuiModel.xml"));

		// ---- Get the root element ----
		System.out.println("Root " + doc.getDocumentElement().getNodeName());

	      // ---- Get list of nodes to given MainButton ----
		NodeList mainButtons = doc.getElementsByTagName("MainButton");

		// ---- Run through the MainButton and all MainButton which exists in XML file
		for (int i = 0; i < mainButtons.getLength(); i++) {
			Element mainButton = (Element) mainButtons.item(i);

			// ---- Run through the MainButton and fetch all element which are taged as ChartName
			Element chartName = (Element) mainButton.getElementsByTagName("ChartName").item(0);
			name = chartName.getTextContent();
			System.out.println("ChartName = " + name);

			// ---- Buttons on the Panel are created here ----
			JButton btn = new JButton(name);
			btn.setPreferredSize(new Dimension(180, 30));
			btn.setActionCommand(name);
			p.add(btn);

			// ---- NodeList is created which fetches all the tagged Attributes ----
			NodeList nodeLst = doc.getElementsByTagName("MainButton");

			for (int s = 0; s < nodeLst.getLength(); s++) {
				Node fstNode = nodeLst.item(s);

				// ---- Fetch the Attributes which is tagged ----
				if (fstNode.hasAttributes()) {
					NamedNodeMap map = fstNode.getAttributes();
				}
			}
		}

		return p;
	}

	private JFreeChart createChart(){
		JFreeChart chart = ChartFactory.createLineChart(
				"",
				"",
				"",
				dataset,
				PlotOrientation.VERTICAL,
				true,
				true,
				false);
		return chart;
	}

	//later the action will be added to the buttons
	@Override
	public void actionPerformed(ActionEvent e) {
		if (e.getActionCommand().equals( name + "LOC")) {
			// ---- Execute when button is pressed ----
			System.out.println("You clicked the button " + name);
			final LOC test = new LOC("");
			test.pack();
			setDefaultCloseOperation(EXIT_ON_CLOSE);
			test.setVisible(true);
		}
		}
	}
[XML]<?xml version="1.0" encoding="UTF-8"?>
<OptimISEGuiModel>
<MainButton>
<ChartName>LOC</ChartName>
<charttype basetype="Cartesian">
<chartrenderer useAlertColors="true" type="LineChart" mode="LineChart"> </chartrenderer></charttype>
<legend visible="true" position="right" background="white" foreground="" />
<labelrenderer color="" offset= "" rotation= "" visible=""/>
<datasetlegend match="" display="Arch" showValue="true" showStart=" (total: " showEnd=")"/>
<graph name="Arch" value="50" color="0x808080"/>
<datasetlegend match="" display="Other" showValue="true" showStart= " (total: " showEnd=")" />
<graph name="Other" value="50" color="0xCC3333"/>
<datasetlegend match="" display="Model" showValue="true" showStart=" (total: " showEnd=")"/>
<graph name="Model" value="50" color="0x0000FF"/>
<datasetlegend match="" display="App" showValue="true" showStart=" (total: " showEnd=")" />
<graph name="App" value="50" color="0x009F6B"/>
<!-- not sure if this is going to work -->
<xaxis>
<annotation match="App" text="ReportingDate"/>
</xaxis>
<yaxis> <annotation match="" text=""/></yaxis>
<Archcolor> value="Grey"</Archcolor>
<Othercolor> value="Red"</Othercolor>
<Modelcolor> value= "Blue"</Modelcolor>
<Appcolor> value="Green"</Appcolor>
</MainButton>
<MainButton>
<ChartName>Sir Statistics</ChartName>
</MainButton>
<MainButton>
<ChartName>Test Statistics</ChartName>
</MainButton>
<MainButton>
<ChartName>Issue</ChartName>
</MainButton>
<MainButton>
<ChartName>Rappidd</ChartName>
</MainButton>
</OptimISEGuiModel>
[/XML]
 damit es so aussieht wie in das Bild (siehe Anhang von Oben)